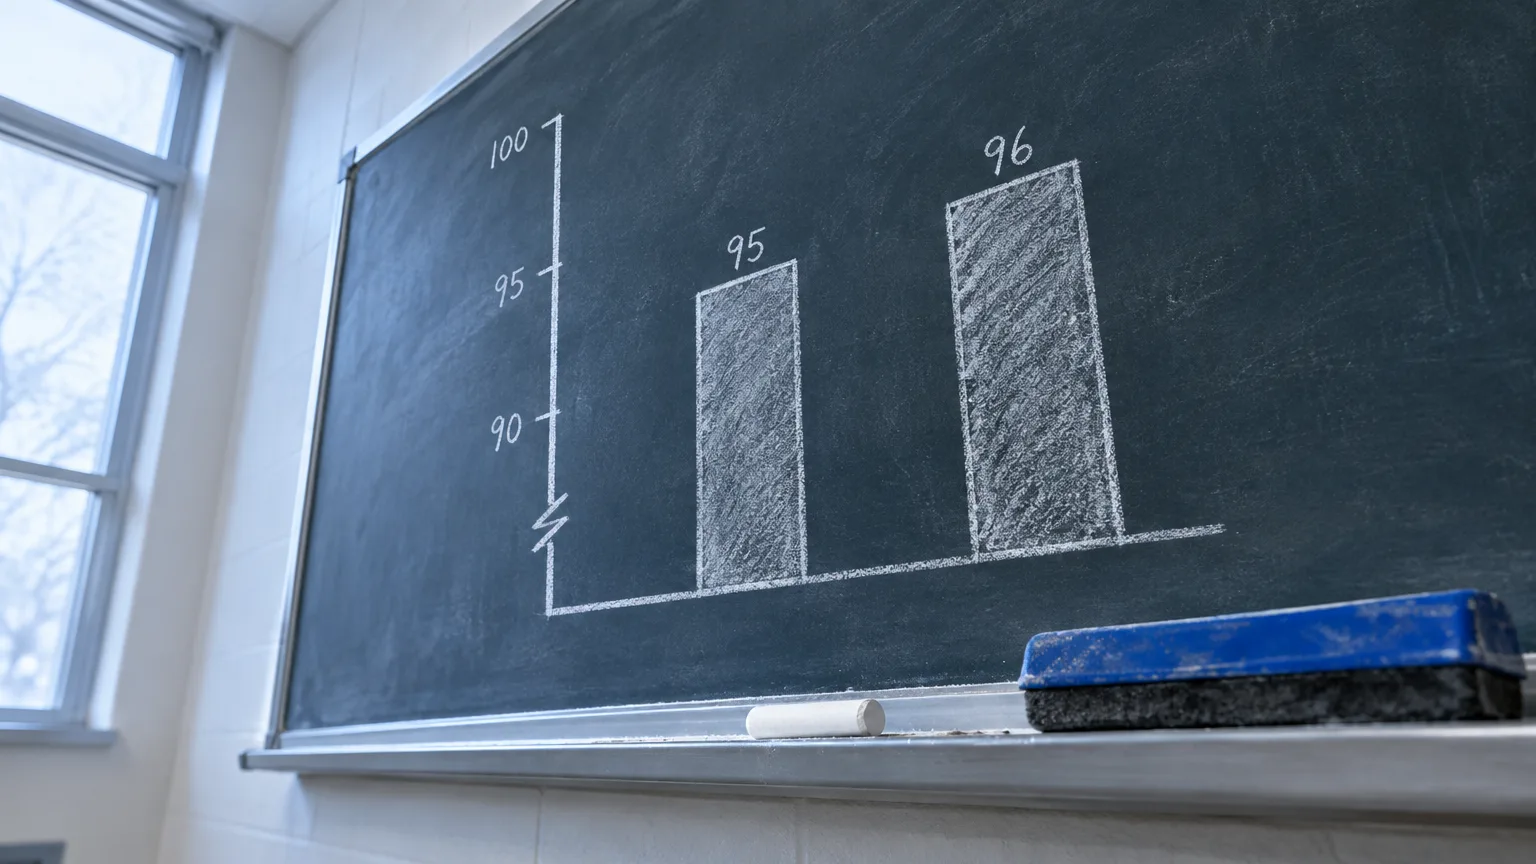
A graph can use real numbers and still give the wrong impression. A small change can look enormous if a bar chart starts at 95 instead of zero. Two trends can appear to move together because they use different scales. A rise in cases can look alarming until you learn that the population being counted also grew.
Checking a graph won’t tell you whether its author meant to mislead. It will tell you whether the picture supports the claim attached to it. You don’t need statistics software; most problems become visible when you slow down and read the numbers rather than the shapes.
Before you start
Have these at hand:
- The full-size graph, including its title, labels, legend and footnotes. A cropped screenshot may hide the very detail you need.
- The article or post that makes the claim, so you can compare its wording with what the graph shows.
- A calculator or scratch paper for simple differences, percentages and rates.
- The underlying data or original report, if it’s available. You can do a first pass without it.
1. Identify the claim you’re being asked to believe
Put the headline into a plain sentence: “Sales doubled,” “Group A is far ahead of Group B,” or “The policy caused a decline.” Then ask which part of that sentence the graph could actually establish.
A chart showing sales before and after a policy might show a decline; by itself, it cannot establish that the policy caused it. A chart showing two years of data might support “higher than last year,” but not “higher than ever.” This first step gives you a target for the rest of the check: you’re testing the stated claim, not just looking for an oddly shaped axis.
Pay attention to the title, too. “Prices soar” is an interpretation; “Average price rose from $100 to $110” is a description you can test. If the headline sounds much stronger than the labeled values, keep that gap in mind.
2. Read every axis label and unit
Start with the horizontal axis, usually along the bottom, and the vertical axis. Work out what each measures and in what units: dollars, people, percentages, cases per 100,000 people, or an index set to 100 at a chosen date. Check whether the labels refer to a whole population or only a subgroup.
Don’t assume a chart shows what its headline describes. A line labeled “number of reports” does not necessarily show the number of events that occurred; reporting can change. Likewise, a percentage on the vertical axis needs a defined group underneath it: 40% of whom?
Missing labels are a reason to pause, not proof of deception. Sometimes the title or subtitle supplies the units instead. What matters is whether a reader can tell what each value represents and which data have been excluded. If you can’t answer that, don’t treat the visual difference as a measured one.
3. Check where a bar or area chart begins
Find zero on the value axis. Bars encode quantities through their lengths, so cutting off the lower part of the axis can make a modest difference look huge. If two values are 100 and 110, the second is 10% higher. Plot them as bars starting at 95, though, and the visible lengths are 5 and 15 units: one appears three times as long as the other.
A cropped axis is especially easy to miss when the bars fill most of the chart. Read the tick mark at the base rather than assuming the bottom border means zero. The zero-baseline guidance for filled bars and areas reflects the fact that readers compare their lengths.
Don’t apply that rule blindly to lines. A line chart uses the position of points to show movement over time; a clearly labeled range above zero can reveal small but meaningful changes. Still check how large the change is in numbers, not merely how steep the line looks. A line that fills the height of a cropped chart may represent a move from 98 to 100, not a dramatic shift.
4. Test the spacing of the scale
Read three or four consecutive tick marks. On an ordinary linear scale, equal distances represent equal numerical changes: 0, 10, 20, 30. A logarithmic scale cannot include zero. Labels such as 1, 10, 100 and 1,000 can be equally spaced on a base-10 logarithmic scale, where equal distances represent multiplication rather than addition.
A log scale isn’t inherently misleading. It can make a wide range of values easier to see, and CDC guidance describes uses for it when disease rates span a wide range. But you should not read the vertical distance on that chart as a fixed number of cases or percentage points. Check the labels and use the values when describing the change.
Look for breaks in an axis as well. A marked break may be a practical way to fit a large outlier into a chart; an unmarked jump can disguise how far apart values really are. If the chart uses uneven time intervals, note those too. Equal horizontal gaps between January, February and June can make a change appear to have happened at a different pace.
5. Compare scales across panels and paired lines
When two small charts sit side by side, check whether their axes share the same minimum, maximum and tick spacing. Two lines can look equally volatile if each panel is fitted tightly to its own values, even when one changes far more than the other. Compare the labeled changes before comparing the shapes.
In a chart with a left and a right vertical axis, trace each line to its own scale. If one line represents dollars and the other represents percentages, their crossing point has no direct numerical meaning. Changing either axis range can also make the lines look more alike—or less alike—without changing a single data point. Such charts can be useful, but the two-scale comparison needs careful reading.
If a line’s color doesn’t clearly match an axis, don’t guess. Find the legend or the original chart. A claim that two measures “rose together” should survive a look at their actual values, not depend on how neatly the lines overlap.
6. Inspect the dates and categories left out
Find the first and last dates, then ask why the display begins and ends there. A sharp rise over three months might be a rebound from a low point; a decline might be part of a longer upward trend. Where the claim is about an unusual change, compare the chart with a longer period if the data allow it.
Do the same for categories. A ranking that shows only selected cities, age groups or products may be accurate for those shown but a poor guide to the whole set. Read footnotes for exclusions, changed definitions and missing periods. Also check whether the chart compares like with like: annual totals should not be set against a partial year without making that difference clear.
Selection isn’t automatically suspect. A chart needs boundaries. The question is whether a different reasonable starting date, comparison group or omitted category would materially change the headline. Good chart design shows the comparison needed to understand the finding, not simply the one that produces the sharpest contrast.
7. Check the denominator behind a rate or percentage
Ask what the numbers are divided by. A city with more residents may have more incidents but a lower rate per resident. A company can report more complaints after gaining customers while complaints per customer fall. Neither the count nor the rate is automatically the right measure; that depends on the claim.
Percentages can hide a small base. An increase from 2 cases to 4 is a 100% increase, but the absolute change is 2 cases. Conversely, a small percentage change across millions of people can be consequential. Whenever possible, look at both the count and the relevant population or sample size.
Watch for percentage points being described as percent changes. A rate rising from 10% to 12% rose by 2 percentage points, or 20% relative to its original level. Those statements answer different questions. Write down the calculation before accepting a headline that calls either one a “small” or “large” rise.
8. Look for uncertainty and changes in how data were collected
A close contest in a survey chart may not be a clear lead. Check the sample size, dates, question wording and any reported margin of error—especially for a small subgroup. Pew Research Center’s guidance on poll reporting cautions against reading too much into differences that the survey may not distinguish reliably.
For trends, check whether the measure stayed the same. A change in survey wording, reporting rules or collection method can create a jump that looks like a change in the world being measured. This doesn’t mean you must reject the graph. It means the chart needs an explanation before you treat the break as a real trend.
If uncertainty isn’t shown on the graph, look in its accompanying report. A clean line is not a promise that every plotted value is exact.
9. Recalculate the comparison that matters
Use the labeled numbers or underlying data to express the central result in one sentence: “It rose from 100 to 110, a 10% increase,” or “The count rose, but the rate per person fell.” This is often enough to expose an exaggerated visual impression.
If the values aren’t printed, don’t invent precision by measuring pixels. Find a data table, an interactive chart’s tooltips or the original report. For an important decision, you can make a simple sketch using the same scale for comparable panels, starting bars at zero and marking the full time period. You’re not trying to produce a better-looking chart; you’re checking whether the conclusion still holds when the presentation changes.
How to tell your check worked
You should be able to state what was measured, over which dates, for which group, and how large the difference is. Then compare that sentence with the claim that led you to the graph. If they agree, the chart may be fair even if its design could be clearer. If the claim depends on a cropped bar, mismatched scales or a missing denominator, you’ve found the specific problem—not merely a reason to distrust the picture.
If you still can’t tell, return to the original data and its notes. When a graph will inform a medical, legal, financial or public-policy decision, or depends on complex sampling or statistical adjustments, ask a qualified statistician or subject specialist to review it. A quick visual check can catch distortions, but it cannot settle questions the underlying analysis hasn’t answered.